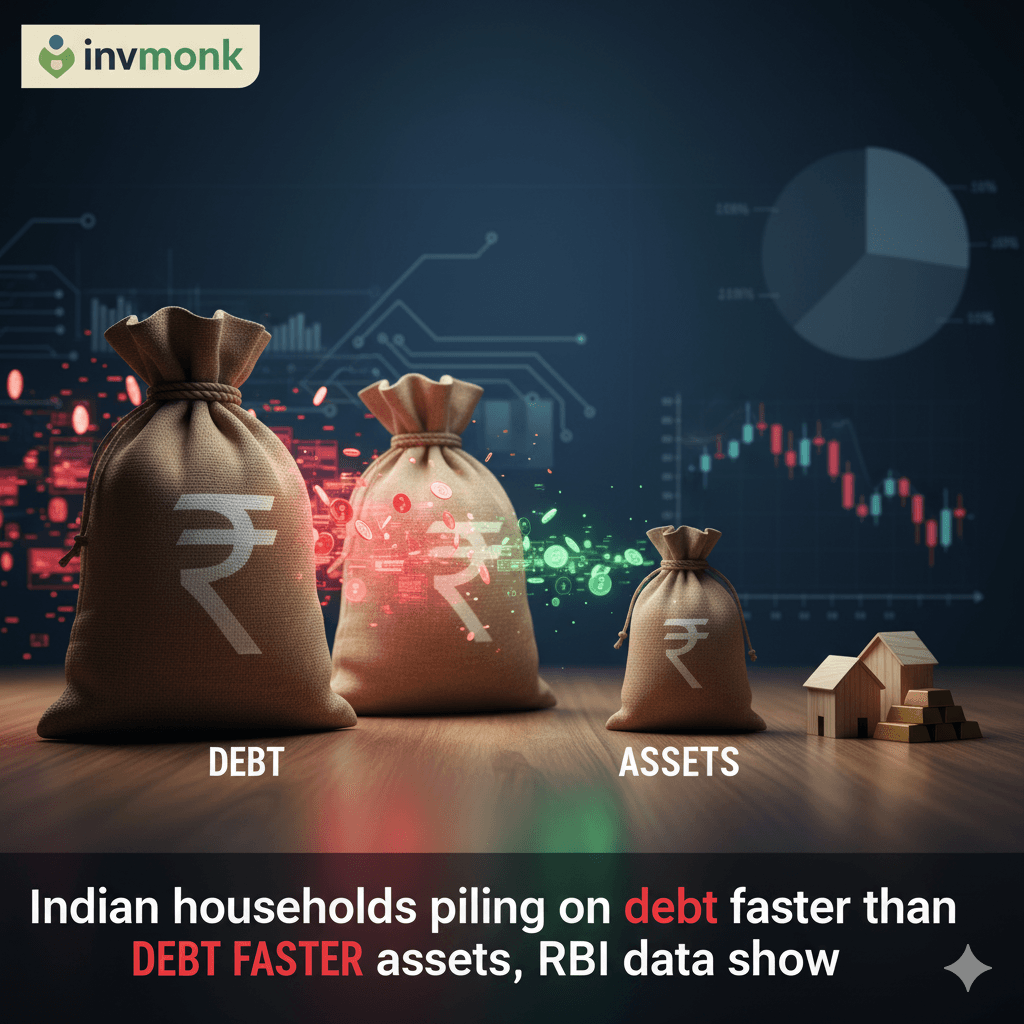
In a stark warning for India’s economic health, Reserve Bank of India (RBI) data uncovers a troubling trend: Indian households are borrowing more aggressively than they’re building wealth. Between 2019 and 2025, annual financial liabilities skyrocketed 102%, outpacing the 48% growth in financial assets added each year. As a share of GDP, asset accumulation has dipped from 12% in 2019-20 to a stagnant 10.8% in 2024-25, while debt piles higher. Amid this imbalance, mutual funds have emerged as a silver lining, drawing savers into equity markets for the first time in droves.
If you’re tracking India household debt 2025 or pondering the RBI financial assets vs liabilities shift, this deep dive analyzes the numbers, underlying drivers, and what it spells for middle-class stability. With post-pandemic recovery uneven, is India’s consumption engine overheating on credit? Let’s break down the RBI’s latest revelations and their ripple effects.
The Numbers Don’t Lie: A Widening Gap in Household Balance Sheets
RBI’s comprehensive analysis paints a picture of cautious optimism overshadowed by cautionary debt dynamics. Households—India’s bedrock savers—once buffered the economy with high savings rates, but the pandemic flipped the script. From FY20 to FY25, the velocity of borrowing accelerated, fueled by easy credit, lifestyle aspirations, and stagnant wage growth.
Key RBI highlights (2019-2025):
- Financial Assets Added: Grew 48% cumulatively, reflecting a shift toward market-linked instruments like mutual funds and equities.
- Financial Liabilities: Exploded 102%, driven by personal loans, home/vehicle financing, and credit card usage.
- As % of GDP:
- Annual asset addition: Slid from 12% (FY20) to 10.8% (FY25), holding steady post-COVID but below pre-pandemic peaks.
- Annual liabilities: Climbed higher, signaling leverage as a growth crutch.
This disparity isn’t abstract—it’s squeezing disposable incomes. Household debt-to-GDP now hovers around 40% (up from 30% in 2019), per broader RBI metrics, edging closer to emerging market averages but raising red flags for a low-income nation.
For RBI household debt trends 2025 observers, the math is merciless: Assets grow modestly amid inflation-eroded savings, while liabilities balloon on EMI culture.
Why the Debt Surge? Post-Pandemic Pressures and Credit Boom
What flipped the switch? The COVID-19 shockwave shattered job security, pushing households toward loans for survival and recovery. RBI data ties the 102% liability jump to:
- Easy Money Era: Post-2020 rate cuts and digital lending apps (e.g., Paytm, Cred) democratized credit, with personal loans up 25% YoY in FY25.
- Asset Price Inflation: Skyrocketing real estate and gold prices lured borrowing for “investments,” but returns lag debt costs.
- Wage Stagnation: Urban salaries grew ~7% annually (vs. 10% inflation), forcing credit for education, weddings, and gadgets.
- Rural-Urban Divide: While urban debt soars on consumer durables, rural households lean on microfinance for agri-inputs.
Mutual funds, however, offer a counter-narrative. SIP inflows hit ₹2.3 lakh crore in FY25 (AMFI data), up 40% YoY, as households pivot from FDs (yielding 6-7%) to equity funds (15%+ avg returns). This “democratization of investing” added ₹1.5 lakh crore to household assets in FY25 alone—yet it pales against the ₹2.8 lakh crore liability spike.
In India personal debt crisis 2025, experts like those at CRISIL warn: Without income growth, NPAs could rise 2-3% in retail lending.
Visualizing the Imbalance: Assets vs. Liabilities Growth (2019-2025)
To grasp the scale, consider this RBI-derived snapshot:
| Year | Annual Assets Added (₹ Lakh Crore) | % Growth YoY | Annual Liabilities Added (₹ Lakh Crore) | % Growth YoY | Assets % of GDP | Liabilities % of GDP |
|---|---|---|---|---|---|---|
| FY20 | 18.0 | – | 8.5 | – | 12.0% | 5.7% |
| FY21 | 16.5 | -8% | 10.2 | +20% | 11.2% | 6.9% |
| FY22 | 19.2 | +16% | 12.8 | +25% | 10.9% | 7.3% |
| FY23 | 22.1 | +15% | 15.4 | +20% | 10.8% | 8.1% |
| FY24 | 24.5 | +11% | 18.7 | +22% | 10.8% | 9.2% |
| FY25 | 26.6 | +9% | 17.2* | +102% (cum.) | 10.8% | 9.5%* |
*Note: FY25 provisional; cumulative growth from FY20 base. Sources: RBI analysis.
The chart (if visualized) would show liabilities’ steeper curve, underscoring a household sector living on borrowed time.
Implications for India’s Economy: Boom or Bubble in the Making?
This debt-asset skew isn’t benign—it’s a tinderbox for stability:
- Consumption Risks: Credit-fueled spending props up 60% of GDP, but rising EMIs (up 15% household average) could crimp discretionary buys, hitting FMCG and autos.
- Banking Stress: Retail loans now 35% of bank books (RBI FY25); delinquency risks loom if job markets soften.
- Inequality Amplifier: Upper-middle class (top 20%) drives 70% of new debt for assets; bottom 40% borrows for essentials, widening the chasm.
- Policy Pivot Needed: RBI’s neutral stance eyes rate hikes if inflation ticks up, but fiscal measures—like skill programs—could boost incomes.
Bright spots? Mutual funds’ rise signals financial literacy gains, with 10 crore+ unique investors (SEBI 2025). Tax perks under Section 80C are channeling savings smarter, potentially stabilizing assets long-term.
For India economic outlook 2026, economists forecast 6.5-7% GDP growth, but household deleveraging could shave 0.5% if unchecked.
Charting a Safer Path: Tips for Households and Policymakers
Households: Prioritize emergency funds (6 months’ expenses) and diversify—mutual funds via SIPs beat gold hoarding. Track debt-service ratios; refinance high-interest loans.
Policymakers: Accelerate wage-linked schemes (e.g., expand PMEGP) and cap predatory lending. RBI could mandate debt counseling in apps.
As India aspires to $5 trillion economy status, taming household debt is non-negotiable. The RBI’s wake-up call: Borrow to build, not burden.
What’s your strategy amid rising India household liabilities 2025? Share in comments—debt stories or mutual fund wins. Subscribe for more on RBI economic reports, personal finance India, and post-pandemic recovery trends. Knowledge is your best asset.